
Looking at this graph we can see that there is nearly an equal balance of males and females, however as there are a few more females the findings may be a bit biased.

Looking at these results it is evident that the results will be biased towards the age group 15-18 year olds.


Looking at this graph we can see that there is a vast difference in those who never go the gym to those who go daily thus suggesting that the people who answered are questionnaires are not committed gym goers. However when comparing those who do and do not go the gym it is an equal split whereby 16 go the gym and 13 do not and 1 person sometimes goes.

Looking at this graph we can see that the majority of people rank their appearance highly which suggests that appearance is an important factor in today’s society.

Looking at this graph we can see that the vast majority of those who answered our questionnaires do not diet regularly which may suggest that although they rank their appearance highly they like their food more.

Looking at this graph we can see that celebrities who go on ridiculous diets do not influence a lot of people as only one person said they have ever been on one.

Looking at this graph we can see that the popular answer was 5-10 minutes with 10-20 minutes a close contender which suggests that although they care about their appearance they are not obsessed with it.
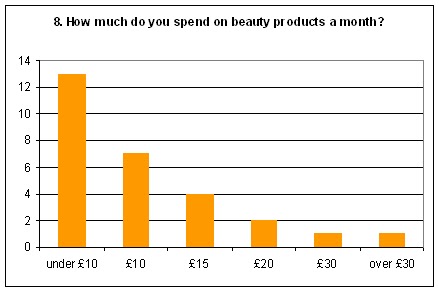
Looking at this graph we can see that a lot of people only spend under £10 a month on cosmetics this is probably because the cosmetics are cheap yet last a long time so it is not necessary to spend over £10 a month.

Looking at this graph we can see that people all have different ideas of an ideal body shape however the celebrities that were named the most were Beyonce and Cheryl Cole which is interesting as they both have very different body shapes.

Looking at this graph we can see that both Topman and River Island are the most popular shops however they are both relatively expensive which suggests that when it comes to clothing those who answered our questionnaires are prepared to spend a little more.

Looking at this graph we can see that the most popular magazine is NME which is a music magazine thus suggesting that those who watch our documentary will want good music in the background.

Looking at this graph we can see that the most popular colour choice is blue so this will feature throughout our documentary.

Looking at this graph we can see that the most popular choice of music is indie but with rock and pop close seconds so we can choice which genre will best suit our tone for the documentary.


Looking at this graph we can see that the most popular TV channel is channel 4 and our audience watch it daily so this is our chosen channel for our documentary as it will suit nearly all of our audience.
No comments:
Post a Comment